Plotting Satellites
This discussion about the recent drop in altitude of the latest Starlink satellite generation is interesting. It piqued my interest in the available data and the process of plotting it.
The V2 Mini sats seem to be collectively lowering their altitude. @planet4589 is this to be expected? Trajectory is certainly uncommon when looking at other Starlink launches. pic.twitter.com/O4iwWFyyHb
— Starlink Insider (@starlinkinsider) March 16, 2023
I came across two sources of data. Celestrak updates its data 3-4 times a day, but I couldn’t find any historical data there.
On the other hand, Space-Track, managed by Space Force, contains historical data dating back to Sputnik. Accessing Space-Track data requires an account, and there are specific rates for data queries. Fortunately, Frazer McLean has developed a Python module that handles authentication and rate-limiting for you.
To start off, let’s install the spacetrack module and authenticate:
!pip install spacetrack skyfield

from spacetrack import SpaceTrackClient
from getpass import getpass
import pandas as pd
import numpy as np

username = input('Username: ')
password = getpass('Password: ')

st = SpaceTrackClient(username, password)
To start, we need a list of the satellites that were launched. Next, we will iterate through this list to retrieve each satellite’s historical data and store it in a pandas DataFrame. Since all the data is in string format, we need to convert it into the appropriate datatypes to ensure compatibility. Although not all data required conversion, I performed it anyway. The final step before plotting is to pivot the table, making the EPOCH column the index datetime, while each satellite’s perigee or apogee values will become the corresponding columns.
def getSatelliteData(st, launch_year, launch_num):
 output = pd.DataFrame()
 sats = st.satcat(launch_year=launch_year, launch_num=launch_num,
                   current='Y', orderby='launch desc')

 df = pd.concat([pd.DataFrame(st.tle(norad_cat_id=x['NORAD_CAT_ID'], orderby='epoch desc'))
                  for x in sats])

  # https://www.space-track.org/basicspacedata/modeldef/class/tle_latest/format/html
 df['NORAD_CAT_ID'] = pd.to_numeric(df['NORAD_CAT_ID'])
 df['EPOCH'] = pd.to_datetime(df['EPOCH'], format='%Y-%m-%d %H:%M:%S')
 df['EPOCH_MICROSECONDS'] = pd.to_numeric(df['EPOCH_MICROSECONDS'])
 df['MEAN_MOTION'] = pd.to_numeric(df['MEAN_MOTION'], downcast='float')
 df['ECCENTRICITY'] = pd.to_numeric(df['ECCENTRICITY'], downcast='float')
 df['INCLINATION'] = pd.to_numeric(df['INCLINATION'], downcast='float')
 df['RA_OF_ASC_NODE'] = pd.to_numeric(df['RA_OF_ASC_NODE'], downcast='float')
 df['ARG_OF_PERICENTER'] = pd.to_numeric(df['ARG_OF_PERICENTER'], downcast='float')
 df['MEAN_ANOMALY'] = pd.to_numeric(df['MEAN_ANOMALY'], downcast='float')
 df['EPHEMERIS_TYPE'] = pd.to_numeric(df['EPHEMERIS_TYPE'])
 df['ELEMENT_SET_NO'] = pd.to_numeric(df['ELEMENT_SET_NO'])
 df['REV_AT_EPOCH'] = pd.to_numeric(df['REV_AT_EPOCH'], downcast='float')
 df['BSTAR'] = pd.to_numeric(df['BSTAR'], downcast='float')
 df['MEAN_MOTION_DOT'] = pd.to_numeric(df['MEAN_MOTION_DOT'], downcast='float')
 df['MEAN_MOTION_DDOT'] = pd.to_numeric(df['MEAN_MOTION_DDOT'], downcast='float')
 df['FILE'] = pd.to_numeric(df['FILE'])
 df['OBJECT_NUMBER'] = pd.to_numeric(df['OBJECT_NUMBER'])
 df['SEMIMAJOR_AXIS'] = pd.to_numeric(df['SEMIMAJOR_AXIS'], downcast='float')
 df['PERIOD'] = pd.to_numeric(df['PERIOD'], downcast='float')
 df['APOGEE'] = pd.to_numeric(df['APOGEE'], downcast='float')
 df['PERIGEE'] = pd.to_numeric(df['PERIGEE'], downcast='float')
 df['DECAYED'] = pd.to_numeric(df['DECAYED'])

  return df

df = getSatelliteData(st, 2023, 26)

pvt = pd.pivot_table(df, values=['PERIGEE'], index=['EPOCH'], columns=['NORAD_CAT_ID'], aggfunc=np.mean)

pvt.plot(legend=False,
         title="Starlink Group 6-1 (Launch 76, 2023-026)",
         xlabel="Date (UTC)",
         ylabel="Height (km)",
         figsize=(15,10))

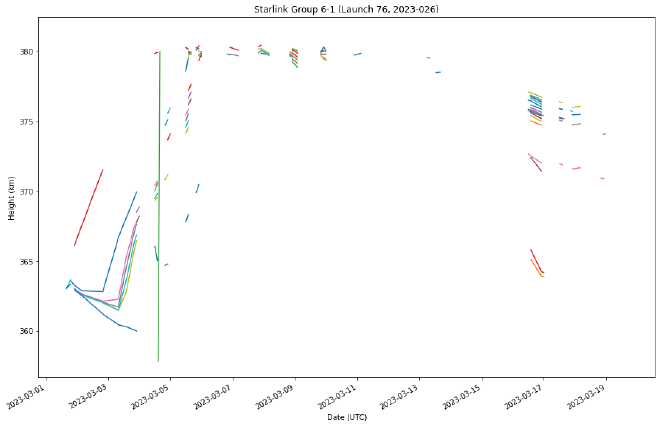
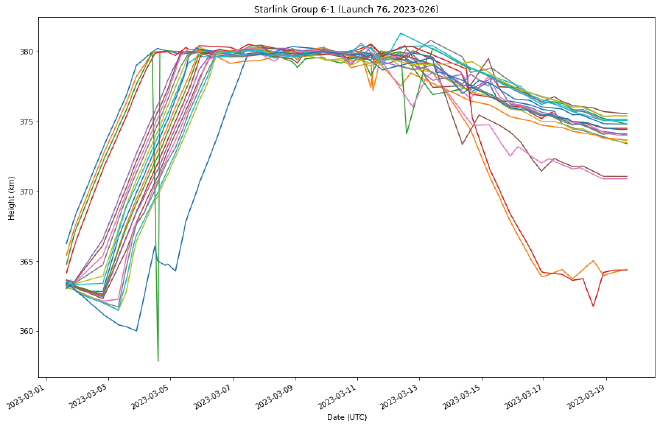
The initial effort needed to be improved as there were missing data gaps that must be addressed before plotting. An easy solution is to use the interpolate method, which fills in the gaps by inputting the missing values in the dataframe.
pvt.interpolate(method='time').plot(legend=False,
         title="Starlink Group 6-1 (Launch 76, 2023-026)",
         xlabel="Date (UTC)",
         ylabel="Height (km)",
         figsize=(15,10))

That’s an improvement, but we can do better.
Two-Line Element Sets (TLEs) are a standard data format used to convey information about the orbit of a satellite. They contain detailed information about the satellite’s position, velocity, and other orbital parameters. Using TLEs, we can calculate the satellite’s location in orbit at any given time. Incorporating this data, we can create a more accurate dataframe of each satellite’s altitude for a specific period.
from skyfield.api import EarthSatellite, load, wgs84
from datetime import datetime, timedelta

def calcSatsAltitude(df, minutes):
 ts = load.timescale()

 st = df['EPOCH'].min().to_pydatetime()
 et = datetime.now()
 dt = timedelta(minutes=minutes)

 fdf = pd.DataFrame()

  while st < et:
 sats = {}

    for nci in df['NORAD_CAT_ID'].unique():
 me = df[(df['NORAD_CAT_ID']==nci)&(df['EPOCH']<=st)]['EPOCH'].max()
 tdf = df[(df['NORAD_CAT_ID']==nci)&(df['EPOCH']==me)]

 line1 = tdf['TLE_LINE1'].values[0]
 line2 = tdf['TLE_LINE2'].values[0]
 name = tdf['OBJECT_NAME'].values[0]
 satellite = EarthSatellite(line1, line2, name, ts)

 t = ts.utc(st.year, st.month, st.day, st.hour, st.minute, st.second)
 geocentric = satellite.at(t)
 alt = wgs84.height_of(geocentric)

 sats[name] = alt.km

 fdf = pd.concat([fdf, pd.DataFrame(sats, index=[st])])

 st = st + dt

  return fdf

tdf = calcSatsAltitude(df,5)

tdf.plot(legend=False,
         title="Starlink Group 6-1 (Launch 76, 2023-026)",
         xlabel="Date (UTC)",
         ylabel="Height (km)",
         figsize=(15,10))

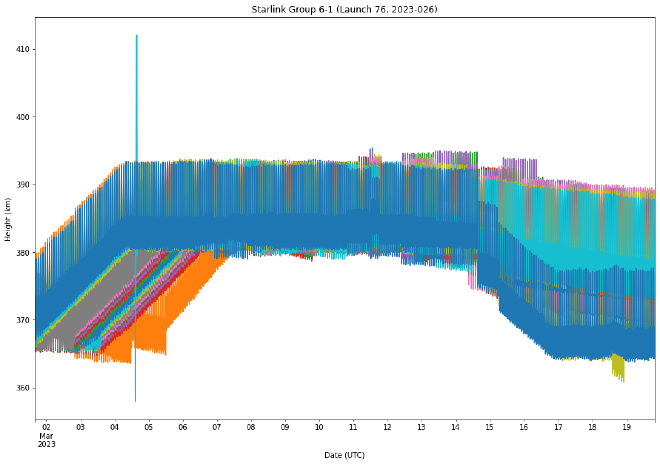
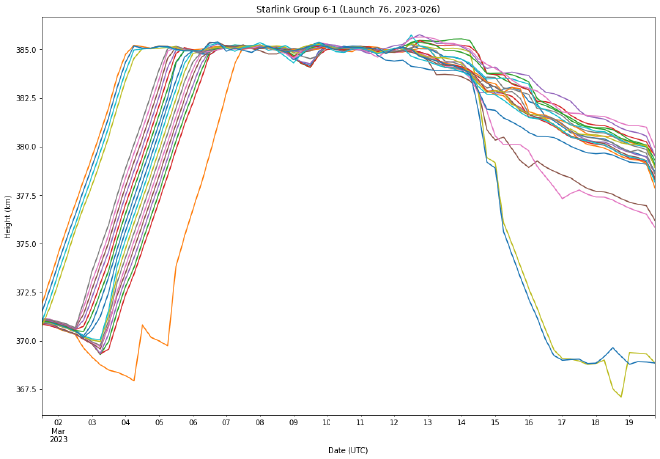
We started out with too little data, and now we have too much. Let’s resample it so that we get the mean for every six hours instead of every 15 minutes. Another way to do this is by using the rolling function.
tdf.resample('6h').mean().plot(legend=False,
         title="Starlink Group 6-1 (Launch 76, 2023-026)",
         xlabel="Date (UTC)",
         ylabel="Height (km)",
         figsize=(15,10))
